
U.S. Real Estate Market Trends
Published:
Project overview
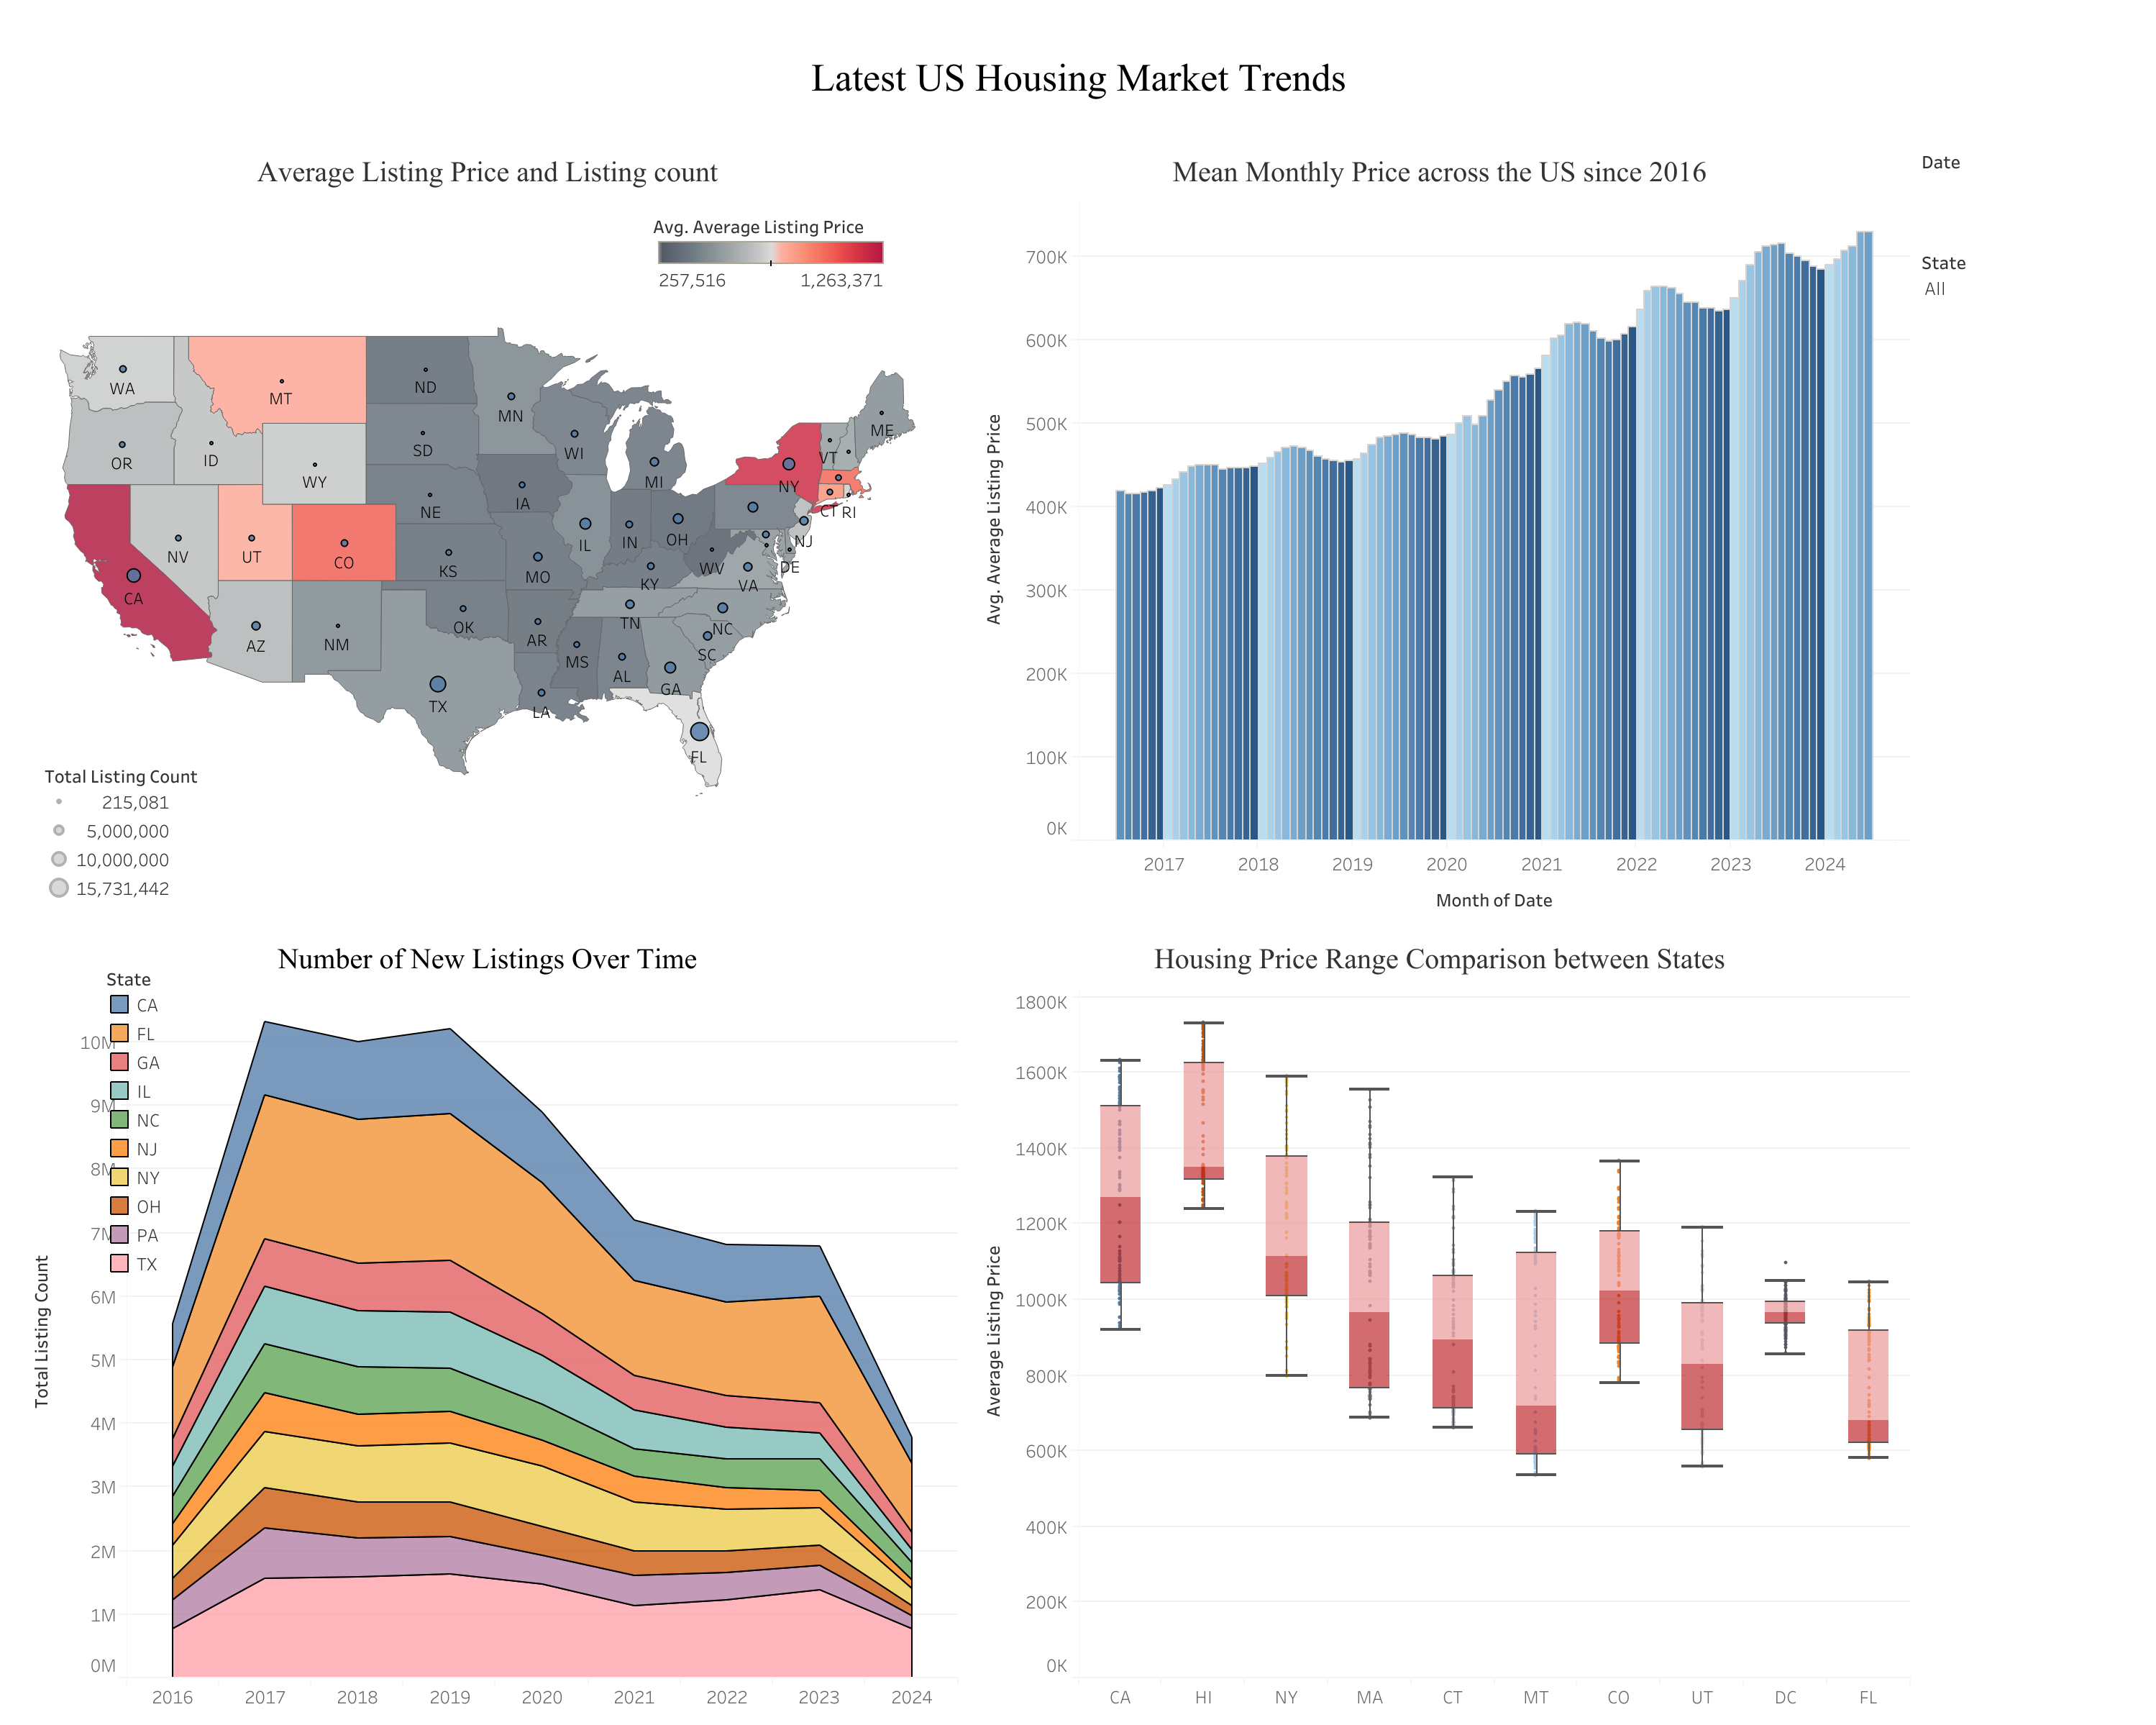
This project explores housing trends across the United States using publicly available real estate data. I first cleaned and explored the data in Python, then designed an interactive Tableau dashboard, and finally recorded a short YouTube walkthrough to explain the main insights and design choices.
My role and tools
- Role: End-to-end design and implementation
- Tools: Python (Pandas, visualization), Tableau Public, Kaggle, YouTube
What the project shows
- How to wrangle raw real estate data in a Jupyter notebook
- How to translate analysis into an interactive Tableau dashboard for non-technical audiences
- How to use Tableau as a business intelligence tool to transform raw data into interactive dashboards, a step-by-step walkthrough of building a dashboard from scratch
Links
- 📓 Kaggle Notebook: full data cleaning and exploration in Python
- 📊 Tableau Dashboard: interactive view of U.S. housing trends
- 🎥 YouTube Walkthrough: guided explanation of the dashboard and key findings